Tell us about your app — free AI scoping
Chat with our AI project engineer. Describe your idea, upload sketches or documents, and get a clear project brief in minutes.
Runs in your browser · free · no signup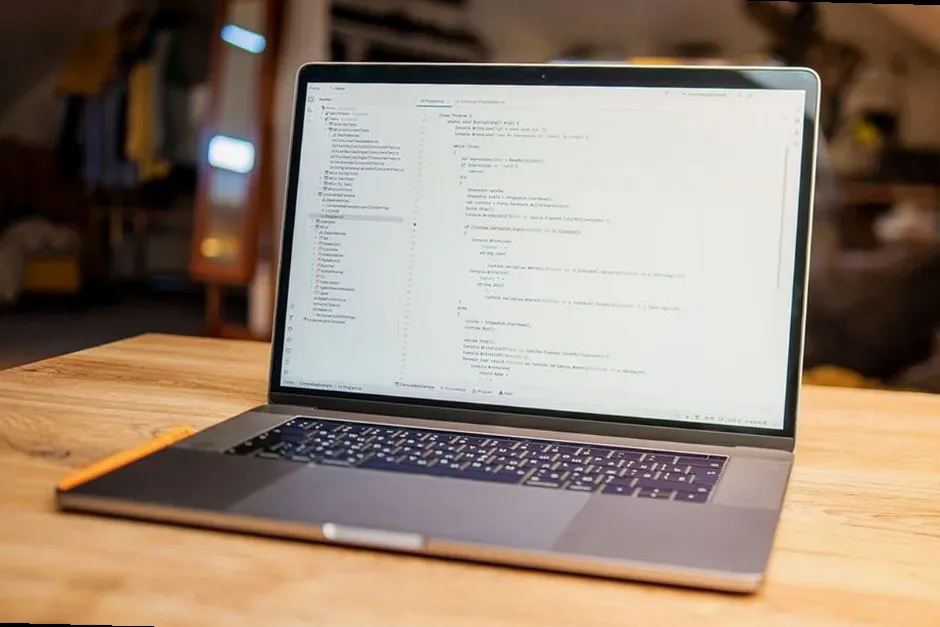
Process
Our methodology for custom dashboard development is a structured, AI-accelerated process designed for reliability and speed. It begins with a collaborative discovery phase to map key performance indicators (KPIs), data sources, and user roles. Senior engineers then architect the solution, leveraging AI-assisted code generation for backend data pipelines and frontend visualization components, automating repetitive work to compress timelines. We implement automated testing, including data validation and performance load testing, ensuring dashboards handle real-time data streams reliably. This approach, governed by senior review at each stage, allows us to deliver a production-ready, scalable dashboard in roughly one quarter of the time required by traditional development shops.
Reference Project Parameters
| Parameter | Reference Value |
|---|---|
| Typical Project Timeline | 4-8 weeks |
| Common Data Source Integrations | 3-5+ (APIs, Databases, Feeds) |
| Frontend Framework Standard | React with TypeScript |
| Backend Latency Target | < 200ms for core queries |
| Data Refresh Interval | Real-time to 15-minute batches |
Local Considerations — USA
Dashboard demand in the United States varies significantly by regional industry clusters. In tech hubs like San Francisco, requirements center on SaaS product analytics and AI model performance monitoring. New York's financial and media sectors need real-time trading floors and content engagement metrics, while Boston's biotech firms require dashboards for clinical trial data. Our AI-accelerated delivery model is particularly valuable for these fast-moving sectors, where the ability to iterate and deploy a custom business intelligence platform in weeks, not months, provides a decisive competitive edge. We serve these national needs from our central engineering team based in Orlando, a growing hub for tech talent and innovation.
Request a Quote
Our team reviews your project and issues an initial report at no cost.
Or write us directly at [email protected]
Technology Stack
- WCAG 2.2 AA Accessibility
- SOC 2 Type II Security Framework
- OWASP Application Security Standards
- Responsive Design Principles
Frequently Asked Questions
How can you deliver a custom dashboard so quickly?
Our timeline of 4-8 weeks is achieved through an AI-accelerated development workflow. AI augments our senior engineers by automating repetitive tasks in code generation, data pipeline setup, and test creation. This automation, combined with strict senior-level architecture review and quality assurance, allows us to build at roughly four times the speed of a traditional agency without compromising on code quality or scalability.
What technology stack do you use for dashboard development?
We standardize on modern, proven technologies for performance and maintainability. The frontend is typically built with React and TypeScript using libraries like D3.js or Recharts for visualizations. The backend employs Node.js or Python with frameworks like Express or FastAPI, connecting to data warehouses like PostgreSQL or cloud services such as AWS Redshift, all deployed on scalable cloud infrastructure.
How do you ensure data security and compliance in your dashboards?
Security is integrated from the initial architecture. We implement role-based access control (RBAC), encrypt data in transit and at rest, and adhere to OWASP top ten guidelines. For clients requiring formal compliance, we design to meet SOC 2, HIPAA, or CCPA frameworks, ensuring audit trails, secure authentication, and data privacy by design.
How much does custom dashboard development cost in the USA?
Project cost depends on complexity, including the number of data sources, visualization types, user permission tiers, and required integrations. For a typical enterprise dashboard with real-time features and 3-5 core data integrations, development investment generally ranges from $45,000 to $120,000. We provide detailed, fixed-scope proposals after a technical discovery session.